Impress Your Friends By Visualizing Your Contributions on GitHub
Turn your data into beautiful images.
GitHub is my go-to tool when it comes to the code I write. I have tried both Bitbucket and GitLab in the past. Time and time again, I come back to GitHub. May it be because of the UI and UX, I can't get along with the other alternatives. And so I'm happy when I discover new tools that enhance my experience on GitHub. Today I'm going to show you two tools. A Chrome extension and a web app.
Visualize Your GitHub Contributions With Skyline
I am happy that I found this tweet from my friend Simon, sharing GitHub Skyline.
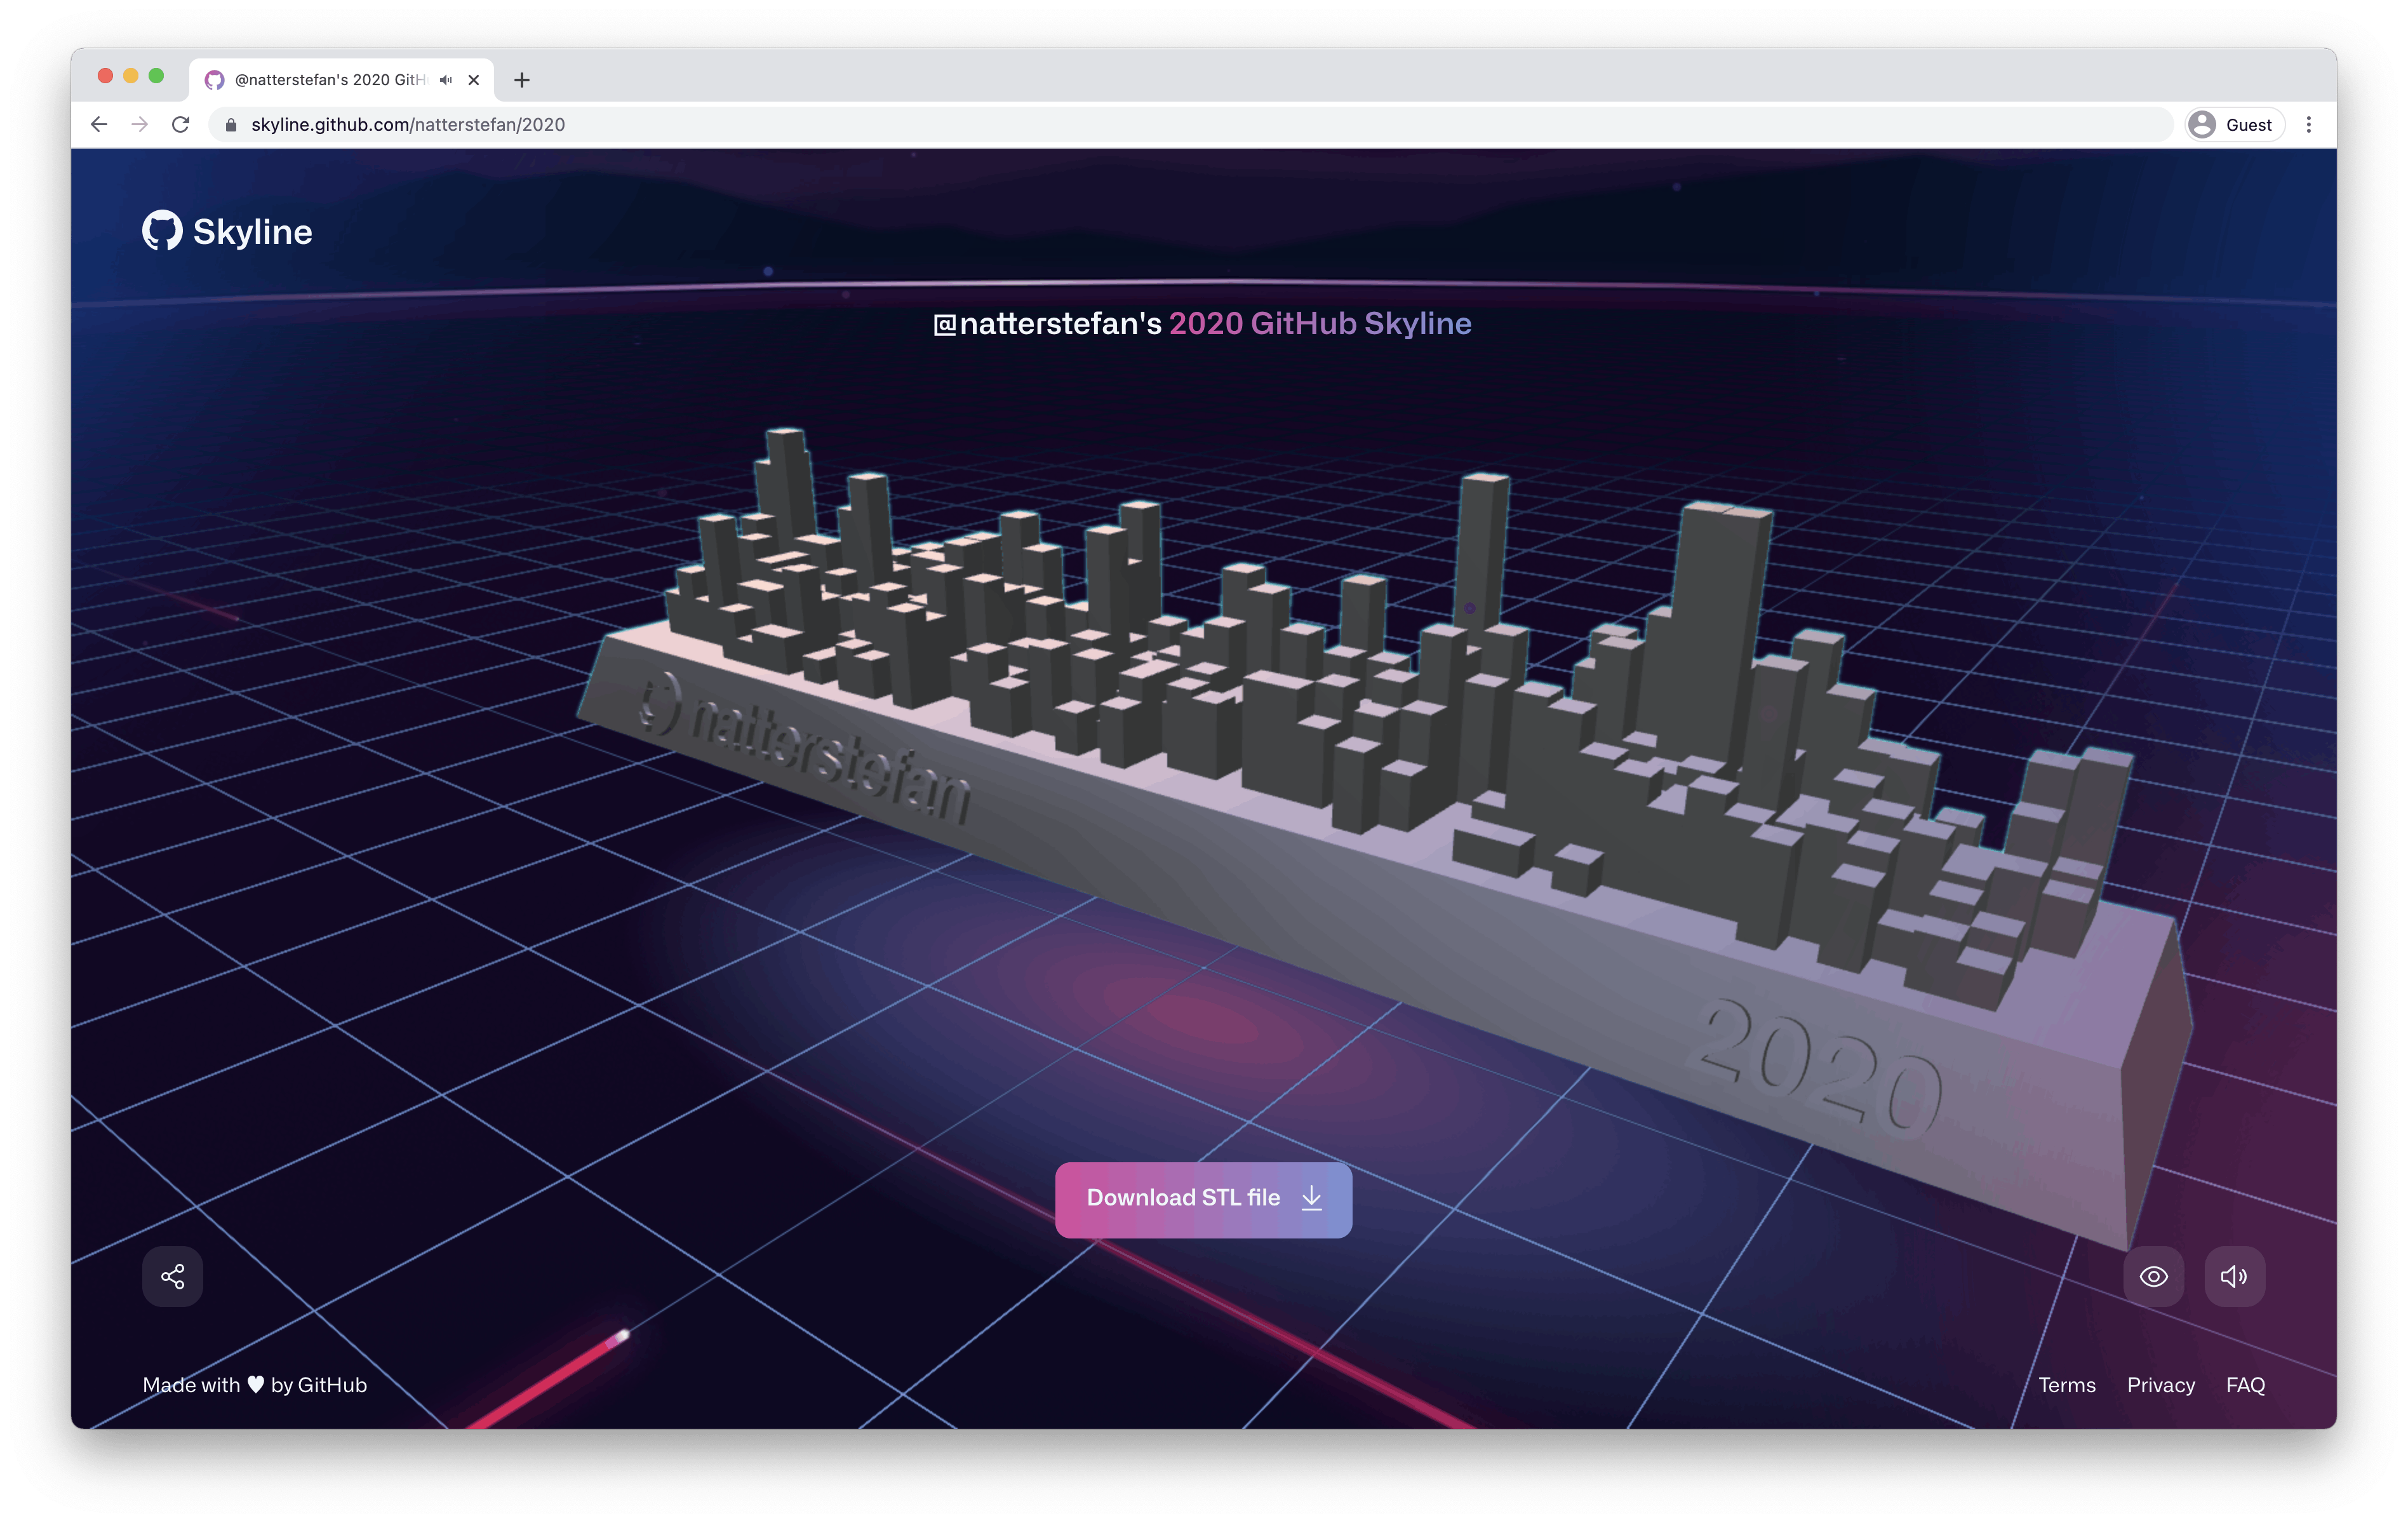
If you know me, you know that this tool immediately excited me. You enter your GitHub username and you get a skyline with the public contributions presented as skyscrapers. Great idea! It's a fun way to encourage people to have more contributions on GitHub.
What does your skyline look like? Here is my GitHub Skyline from 2020. 2021 is in progress.

GitHub Isometric Contributions
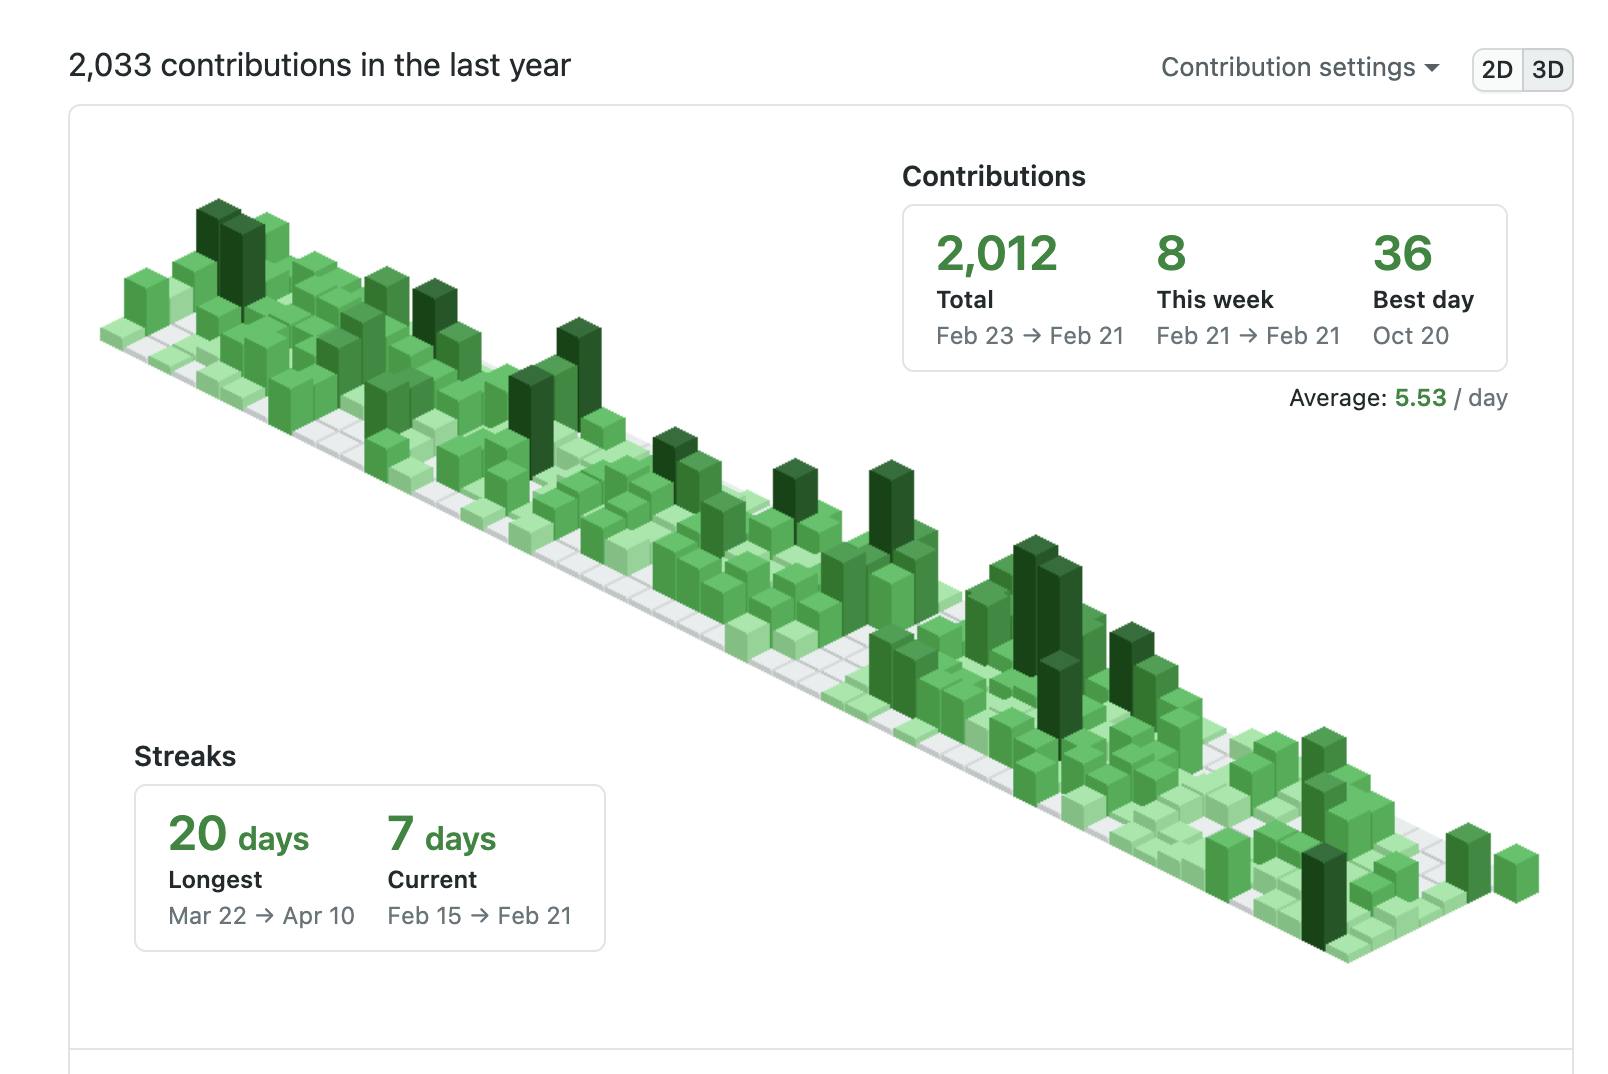
This is another interesting extension for Chrome. It visualizes your GitHub contributions graph and creates an isometric pixel view of the public data on your profile. Here is mine:

PS: Did you know that you can support me on GitHub and become my GitHub sponsor?
Share 💛
Do you like this article? Do you want to support me? Tell your friends on Twitter about it. Thank you!
Questions and Feedback
You got any questions or want to add your thoughts? Let me know in the comments below, please.

